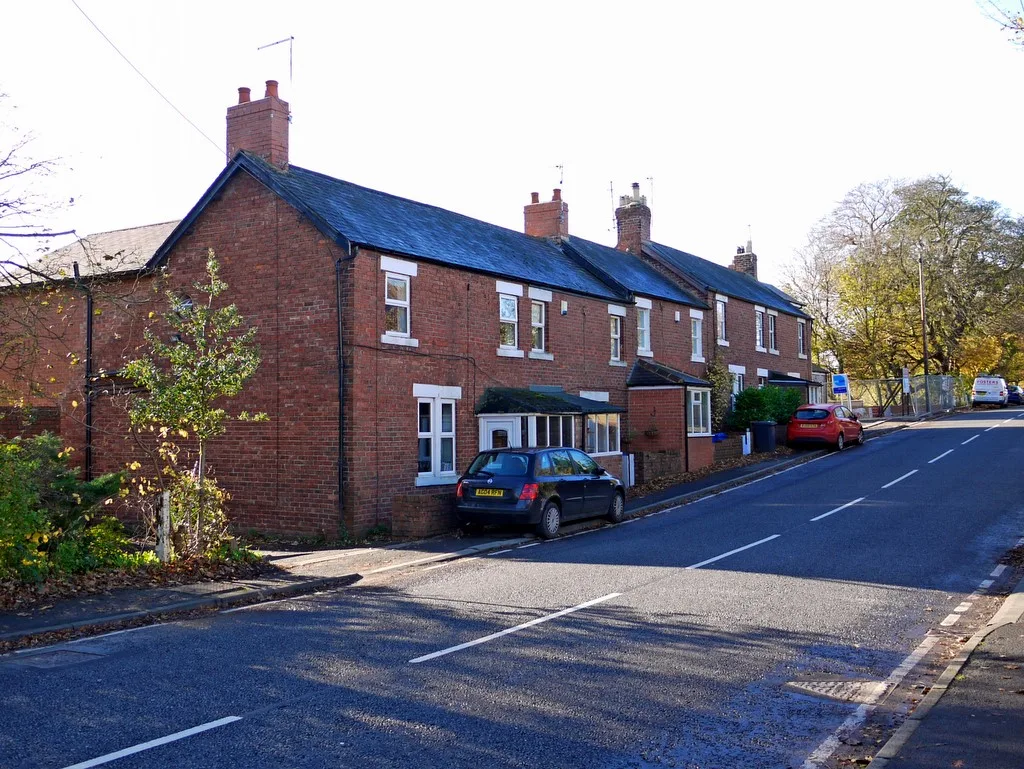

The average Northumberland home sold for £212,563 in July 2026, up 7.3% in a year and the North East's highest. Median sold prices for all ten main postcodes.
Asking prices tell you what sellers hope for. The number that counts is what homes actually change hands for, and every completed sale in England and Wales is recorded by HM Land Registry. This page uses that record two ways: the official county average from the UK House Price Index, and our own query of the raw sold-price data for each of Northumberland’s main postcode districts. It was last checked against the July 2026 release on 17 September 2026.
The short version. Northumberland’s average home sold for £212,563 in July 2026, up 7.3% on the year. Only eight of England’s 295 local authority districts rose faster, and the county still has the highest average in the North East. But a county-wide average hides an enormous spread: the middle sale in Ponteland was £487,500, and in Ashington it was £117,500. Those two towns are twenty miles apart and one costs four times the other.
The headline figure
The provisional average house price in Northumberland was £212,563 in July 2026, up from £198,107 in July 2025, a rise of 7.3% (UK House Price Index). That is the second highest average the county has recorded, just below the revised June figure of £212,936. Northumberland shares ninth place in England for the annual rise with Preston and St Helens. We checked that ranking against the full index for every UK area.
For context, the average across the North East in July 2026 was £166,943 and across England it was £293,479. So Northumberland sits well above its own region and well below the national figure. Being the most expensive place to buy in the North East is a genuine change worth naming: it reflects the pull of Ponteland, the Tyne Valley and the coast rather than a broad rise everywhere.
One caveat that matters when you read any of these numbers. The Land Registry revises each month as more sales complete. June was first published at £213,452 and a 12.6% annual rise, the fastest in England, then cut in the July release to £212,936 and 12.3%, which put it second behind Preston. The July figure will move too.
We wrote up the July release in full, including why the annual rate fell from June’s peak and where Northumberland sits against every other district in England, in Northumberland house prices up 7.3% to £212,563 in July.
Where the money actually is: median prices by postcode
The county average is not much use if you are buying in Blyth or selling in Corbridge. So we queried HM Land Registry’s Price Paid records directly for every sale completed between 1 July 2025 and 30 June 2026 in the ten postcode districts covering Northumberland’s main towns. That is 3,393 sales. These are medians, the middle sale in each area, which is a fairer guide than an average because one large country house cannot drag the figure up.
| Postcode | Main towns | Median sold price | Sales in the year |
|---|---|---|---|
| NE20 | Ponteland | £487,500 | 178 |
| NE45 | Corbridge | £451,000 | 74 |
| NE46 | Hexham | £302,500 | 200 |
| NE66 | Alnwick | £265,000 | 250 |
| NE65 | Amble, Rothbury | £260,000 | 328 |
| NE61 | Morpeth | £242,500 | 572 |
| TD15 | Berwick-upon-Tweed | £190,000 | 233 |
| NE23 | Cramlington | £178,000 | 581 |
| NE24 | Blyth | £137,500 | 537 |
| NE63 | Ashington | £117,500 | 440 |
Two honest caveats about that table. First, it covers ten postcode districts, not the whole county: Northumberland has more than twenty, and Bedlington, Newbiggin, Prudhoe, Haltwhistle, Wooler, Belford and Bamburgh sales are not in these figures. Second, NE23 is shared with North Tyneside, NE20 with Newcastle upon Tyne and TD15 with the Scottish Borders, so a handful of sales in those three will sit just outside the county line.
What it means for you. If you are buying, the county gives you a real choice that most of England does not: a three-bedroom semi in Ashington or Blyth is achievable on a income that would not get you a flat in much of the South, while Ponteland and Corbridge are priced like commuter Surrey. If you are selling in the south-east of the county, the reopened Northumberland Line has changed the pitch for Ashington, Bedlington and Blyth: those towns now have a turn-up-and-go train to Newcastle for £2.40, which they did not have before December 2024.
Prices by property type
The county average splits sharply by what you are buying. These are the Land Registry averages for Northumberland in July 2026:
- Detached: £372,800, up 6.9% over the year. The figure that pulls the county average up.
- Semi-detached: £205,196, up 8.3%, the fastest-rising type.
- Terraced: £171,976, up 7.8%. The most common way into a house here.
- Flats and maisonettes: £105,668, up 3.7%, the slowest of the four.
Our own Land Registry query gives a useful cross-check, because it reports medians rather than averages across the 3,160 sales in nine of those postcodes: detached £365,000, semi-detached £185,000, terraced £140,000 and flats £103,750. The detached and flat figures line up almost exactly with the ONS averages. The semi and terraced medians sit below the averages, which is what you would expect when a smaller number of expensive sales lifts the mean. Our medians also cover the twelve months to June 2026 rather than a single month, so they lag a fast-rising market.
First-time buyers, movers, cash and mortgages
The same data set splits buyers in a way that is genuinely useful if you are working out where you sit.
- A first-time buyer in Northumberland paid an average of £174,820 in July 2026, up 7.6% from £162,426 a year earlier.
- A home mover paid £257,594, up 7.1% from £240,543.
- Buying with a mortgage, the average was £216,997. Buying with cash, it was £206,175.
The gap between the first-time buyer figure and the mover figure, about £82,800, is effectively the size of the step from a first flat or terrace to a family house in this county. For comparison, the first-time buyer average was £145,895 across the North East and £229,302 across Great Britain in the same month. Northumberland is dearer than its region for a first home, and a good deal cheaper than the national picture.
What it costs to rent
If you are not buying, the rental picture matters more. The average monthly private rent in Northumberland was £687 in June 2026, up 6.5% from £645 a year earlier. That is below the North East average of £781 and well below the UK average of £1,388.
| Property | Average rent |
|---|---|
| One bedroom | £489 |
| Two bedrooms | £622 |
| Three bedrooms | £757 |
| Four or more bedrooms | £1,120 |
| Flat or maisonette | £580 |
| Terraced | £689 |
| Semi-detached | £738 |
| Detached | £992 |
Rents rose fastest at the smaller end: one-bedroom rents were up 6.9% over the year against 5.4% for four-bedroom homes.
What could move prices from here
The county is planning for a lot more housing. Northumberland’s new Local Plan has to make room for around 1,700 homes a year, roughly double the requirement in the current plan, and the council has said openly that all settlements will see growth. That is set out in full on our Northumberland planning page. More supply over a twenty-year plan period is the single biggest policy factor pointing the other way from the 7.3% rise recorded in the year to July.
Frequently asked questions
What is the average house price in Northumberland?
The provisional average was £212,563 in July 2026, up 7.3% from £198,107 a year earlier, according to the UK House Price Index built from HM Land Registry sales. Only the revised June figure, £212,936, has been higher.
Where are the most expensive houses in Northumberland?
Ponteland (NE20) has the highest median sold price at £487,500, followed by Corbridge (NE45) at £451,000 and Hexham (NE46) at £302,500. All three are within easy reach of Newcastle, which is a large part of the explanation.
Where is the cheapest place to buy in Northumberland?
Of the ten main postcode districts, Ashington (NE63) has the lowest median at £117,500, then Blyth (NE24) at £137,500 and Cramlington (NE23) at £178,000.
Are Northumberland house prices going up?
Yes, faster than almost anywhere else in England. Prices rose 7.3% in the year to July 2026, against 4.9% across the North East and 1.1% across England. Only eight of England’s 295 districts rose faster. Semi-detached homes rose fastest, at 8.3%.
Is Northumberland expensive compared with the rest of the North East?
It is now the most expensive local authority in the North East by average house price, at £212,563 against a regional average of £166,943 in July 2026. It is ahead of Newcastle upon Tyne (£207,547) and North Tyneside (£205,744). It is still well below the England average of £293,479.
How much do first-time buyers pay in Northumberland?
An average of £174,820 in July 2026, up 7.6% from £162,426 the year before. That compares with £145,895 across the North East and £229,302 across Great Britain.
Where can I check what a specific house sold for?
Every completed sale in England and Wales is public. Look up a street or a single address for free on the HM Land Registry Price Paid service.
Sources
- UK House Price Index, Northumberland (HM Land Registry) for the county average, property-type averages and buyer-type figures. July 2026 release, published 16 September 2026.
- UK HPI full file, July 2026, the complete index for every UK area, used for the England ranking, the regional comparison and the revised June figure.
- ONS local house price and rent figures for the private rent averages.
- HM Land Registry Price Paid Data queried directly for median sold prices in each postcode district, sales completed 1 July 2025 to 30 June 2026.
- HM Land Registry Price Paid search to check any individual address.
ONS figures for the most recent months are provisional and are revised as more sales complete. Check the linked sources before making a decision.
Have your say