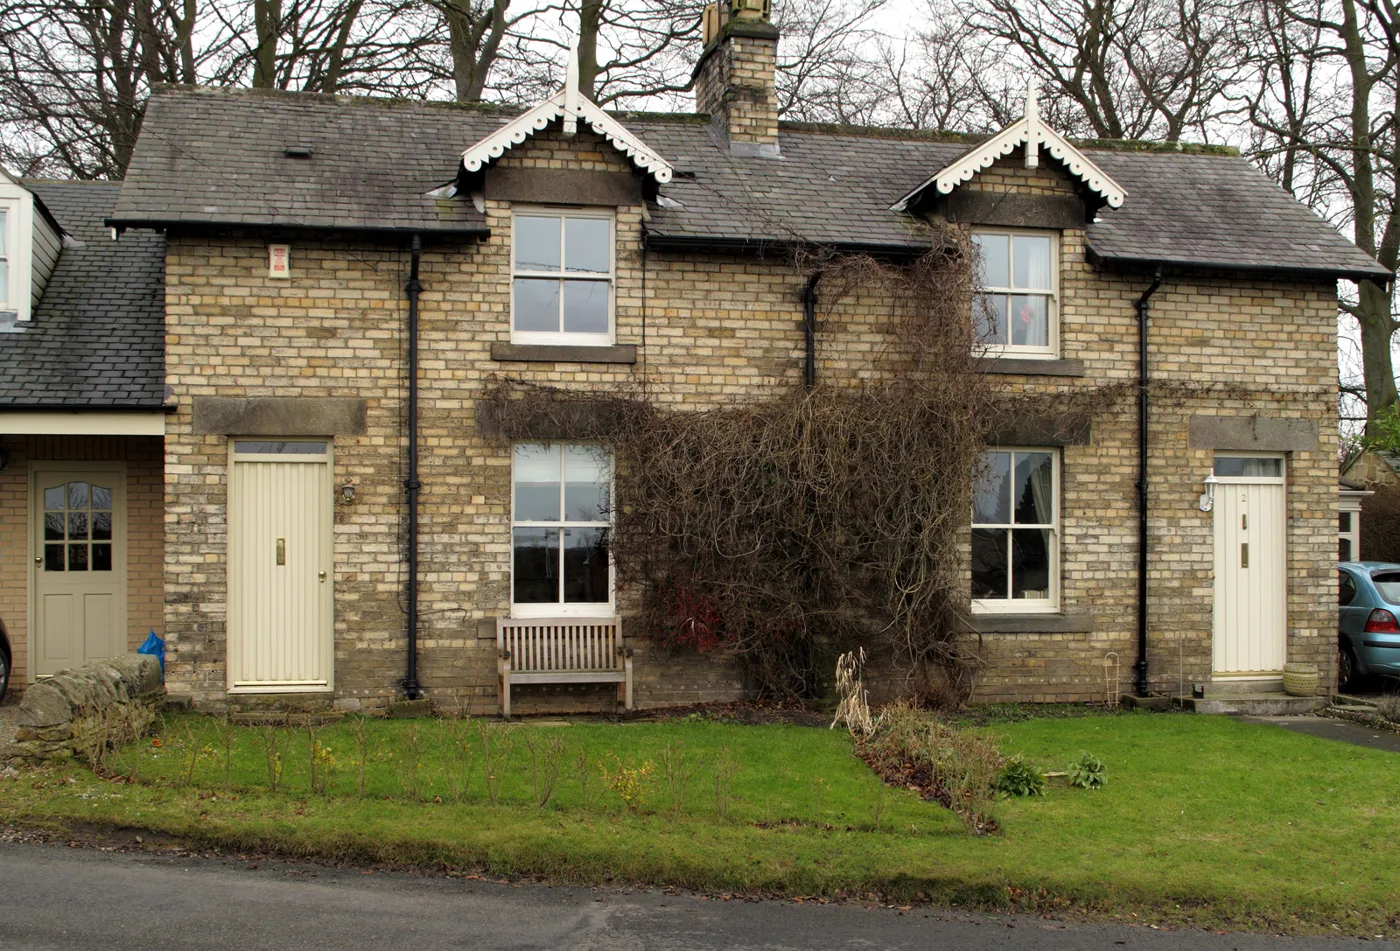

The average Northumberland home hit a record £213,452 in June, up 12.6% in a year. That is the biggest rise of England's 295 local authority areas.
Northumberland house prices rose faster than those in any other local authority area in England in the year to June 2026.
The average home in the county sold for £213,452, up 12.6% on June 2025, according to the UK House Price Index published by HM Land Registry on 19 August. No other English district came close on that measure.
It is also the highest average the county has ever recorded. The previous peak was £209,274 in December 2025.
Top of all 295 districts
We checked the ranking ourselves rather than take it on trust. The Land Registry publishes the whole index as a single file, covering every area and every month, so every figure below comes from the same June 2026 release.
England has 295 local authority districts in that file. Northumberland is first.
The five fastest annual rises in England were:
- Northumberland, up 12.6% to £213,452
- Preston, up 12.4% to £187,709
- Derbyshire Dales, up 11.7% to £353,364
- St Helens, up 11.1% to £186,435
- Westmorland and Furness, up 11.1% to £230,066
Sixty-two of the 295 districts fell over the same year. The average for England as a whole rose 1.8%, to £293,262.
One caveat on the national framing. Across the whole UK, two areas in Northern Ireland and one in Scotland matched or beat Northumberland, so this is an English record rather than a British one.
Dearer than Newcastle
The rise has pushed Northumberland past its neighbours. It is now the most expensive of the North East’s twelve local authority areas, and it has held that position for two months running.
| Area | Average price | Change on the year |
|---|---|---|
| Northumberland | £213,452 | +12.6% |
| Newcastle upon Tyne | £208,589 | +6.7% |
| North Tyneside | £203,813 | +6.0% |
| Stockton-on-Tees | £170,923 | +3.9% |
| South Tyneside | £161,372 | +4.8% |
| Gateshead | £158,254 | +7.8% |
| Darlington | £158,188 | +3.8% |
| Redcar and Cleveland | £153,205 | +8.1% |
| Sunderland | £143,216 | +4.6% |
| County Durham | £138,148 | +7.0% |
| Middlesbrough | £137,773 | +2.0% |
| Hartlepool | £130,271 | +0.8% |
Northumberland was cheaper than both Newcastle and North Tyneside as recently as July 2025. It overtook them in August that year, slipped back over the winter, and regained the lead in May.
The county is still well below the England average. The gap is £79,810.
Semis and terraces rose fastest
The rise was not confined to the expensive end of the market. The two types of home that most people in the county actually buy went up the most.
| Type | Average price | Change on the year |
|---|---|---|
| Detached | £375,682 | +11.9% |
| Semi-detached | £205,876 | +13.5% |
| Terraced | £172,264 | +13.5% |
| Flat or maisonette | £106,020 | +9.3% |
First-time buyers paid an average of £175,619, up 13.2% on the year. Home movers paid £258,560, up 12.1%.
Two things to hold in mind
First, this is a mean average, not a median. It is the total value of sales divided by the number of them, so a small number of large sales in Ponteland, Corbridge or on the coast pulls it up. A county that runs from Blyth to Bamburgh has an unusually wide spread, and the median sold prices by postcode on our house prices page are a better guide to what a home costs in a particular town.
Second, the Land Registry revises these figures as more sales complete. May was first published at £209,135 and an 8.3% annual rise. In the June release it has been cut to £208,334 and 7.9%. April was revised down by £706. The June figure will move too.
Sales volumes come with their own delay. The most recent month the Land Registry will publish a count for is April 2026, at 251 sales. Comparisons with spring 2025 are distorted by the stamp duty threshold change on 1 April that year: Northumberland recorded 782 sales in March 2025 and 269 in April 2025, as buyers rushed to complete.
What it means for you
If you are selling, the county-wide figure is encouraging but it is not your valuation. The gap between towns here is enormous, and the annual rise is measured against a June 2025 figure that was itself a low point. The average fell 1.8% that month.
If you are buying, a 12.6% rise on an average that started at £189,585 is roughly £23,900 added in a year. First-time buyer prices rose faster than the county average, which is the harder end of that news. The reopened Northumberland Line has made Ashington, Bedlington and Blyth commutable to Newcastle by train for the first time in decades, and the south-east of the county is where a lot of that demand is landing.
If you want to check a specific street, every completed sale in England and Wales is public. The Land Registry price paid search is free and covers individual addresses.
On what happens next, the county’s emerging Local Plan has to find room for around 1,700 homes a year, roughly double the current requirement. What that means for each town is set out on our Northumberland planning page.
Sources
- UK House Price Index, Northumberland, HM Land Registry, June 2026 release published 19 August 2026.
- UK HPI full file, June 2026, the complete index for every UK area, used for the England ranking and the North East comparison.
- UK HPI full file, May 2026, used to establish what the May and April figures said before revision.
- HM Land Registry price paid search for individual addresses.
Update, 17 September 2026: the Land Registry has revised June’s figures in its July release. Northumberland’s June average is now £212,936, up 12.3% on the year, rather than £213,452 and 12.6%. On the revised figures Preston (up 13.3%) moved ahead, so Northumberland ranks second in England for June, not first. The June figure is still the highest average the county has recorded. The July figures are in Northumberland house prices up 7.3% to £212,563 in July.
Have your say